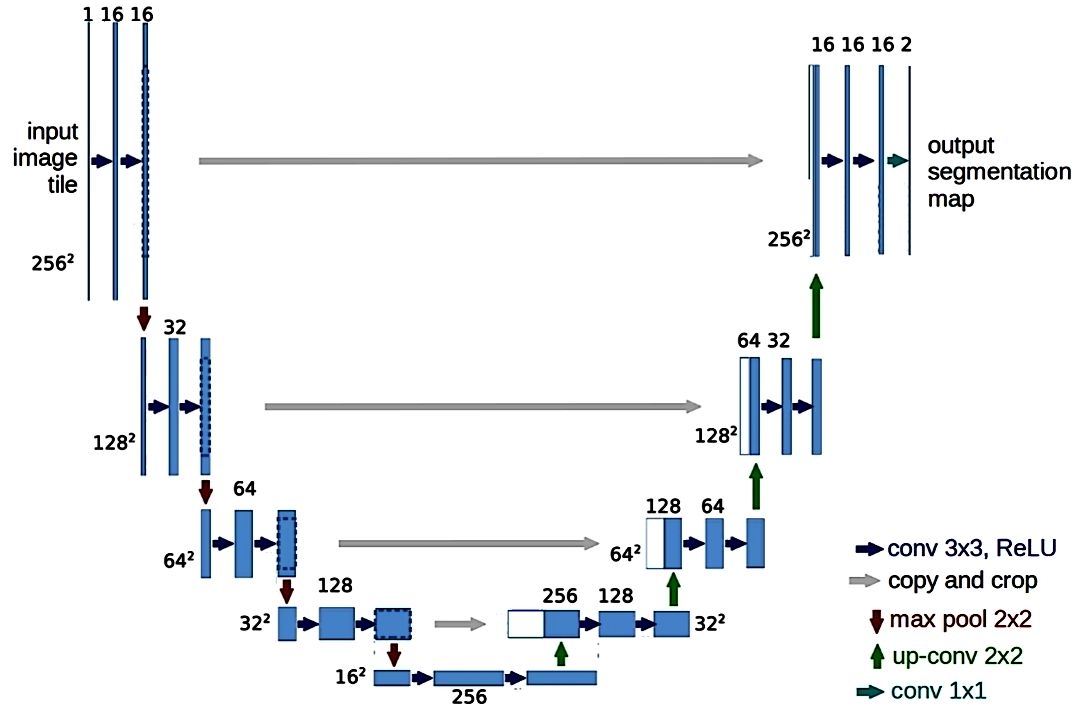
The Segmentation Model
The segmentation model uses a U-Net architecture.
The data was augmented by rotating every image by an angle of
Comparison of Categorical Accuracy between Model 1 and Model 2.
Comparison of Loss between Model 1 and Model 2.
Comparison of Model IOU between Model 1 and Model 2.
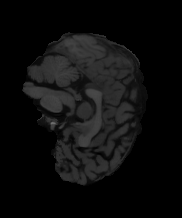
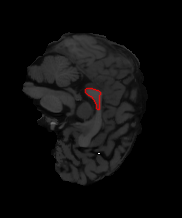
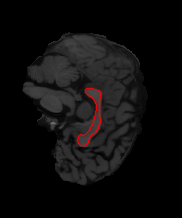
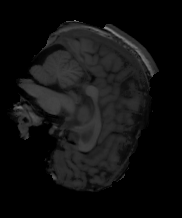
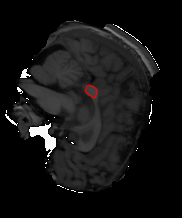
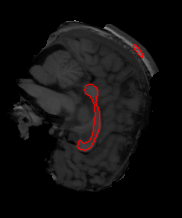
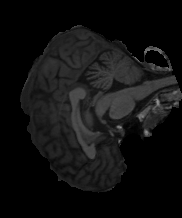
| T1 image | Model V1 predictions | Model V2 predictions |
|---|---|---|
 |
 |
 |
 |
 |
 |
 |
 |
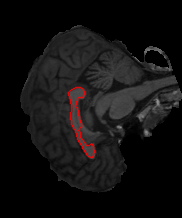 |
*The area enclosed by the red line indicates the resulting masks
Blind Performance Metrics
| Model V1(5718 Images) | Model V2(10953 Images) | |||
|---|---|---|---|---|
| Class | Background | CC | Background | CC |
| Accuracy | 0.995280886 | 0.995280886 | 0.998905092 | 0.998905092 |
| Sensitivity | 0.997443187 | 0.850984659 | 0.999347435 | 0.964329514 |
| Specificity | 0.850984659 | 0.997443187 | 0.964329514 | 0.999347435 |
| PPV | 0.99776626 | 0.832985664 | 0.99954356 | 0.949762916 |
| NPV | 0.832985664 | 0.99776626 | 0.949762916 | 0.99954356 |
| IOU | 0.995220842 | 0.726950136 | Faculty0.99889159 | 0.917528605 |
Quality Control
The output masks from the segmentation are used to perform quality control.
This improves the masks generated.
Model Performance
| Models | Ensemble | Neural Network | Wide & Deep | XGBOOST |
|---|---|---|---|---|
| Accuracy | 96 | 95.4 | 96 | 97 |
| Recall | 78 | 77 | 77 | 80 |
Biological Associations
The relationships between subjects’ biological demographic information, such as age, sex, and health outcome, and extracted CC shape metrics from clean segmentations were analyzed to evaluate which features are most biologically meaningful. Regression and classification models were trained to predict age and neuropsychological health status, respectively. Different feature selection techniques were performed for each association and common relevant features selected in all generally tended to be thickness, curve, and Witelson5 sectioning metrics.